The American Dream
A model for the US Housing Market Cycle

Today we analyze the US Housing Market Cycle:
Hypothesis of how the Cycle works conceptually
Test with real data for different cycles since 1961
Apply the concepts to today’s context
Think about potential scenarios going forward.
How the Housing Market Cycle works
Before understanding what happened, let’s observe it’s most famous iteration:
2000: Tech bubble pops, (housing stable)
2001: Fed cuts rates 11 times
2002: Home sales start rising, driven by lower rates
2003: Sales continue rising, inventory shrinks
2004: Prices rise significantly, economy gets heated, fed raises rates
2005: Prices continue higher but volume declines. Inflation. FOMO buying.
2006: Prices peak. Volumes decline. Rates high & No buyers left.
2007: Prices and volumes decline further. Market in oversupply. Initial rate cuts
2008: Prices and volumes decline further. Financial crisis. Rates set to zero
2009: Fed intervention in MBS market. Home prices stabilize, sales decline
’10/11: Recovery in the employment, housing demand. Home sales rise
2012: Sales continue rising, inventory shrinks (see 2003)
Interestingly, home sales volumes peaked well before prices did. Were the 2005-2006 buyers stupid?
Not exactly. These were people that had seen inflation rising, home prices rising even faster, and interest rates going up, all making it harder to buy a home. They could still afford to buy a home, but were about to get squeezed out.
They bought a home, not because it was a smart investment, but because they wanted it and could afford it today, but maybe not tomorrow…
This situation creates the dynamic in the housing market were volume precedes price. In a strong economy, more people buy houses, and home sales rise. As long as this goes well, both the housing cycle and the economic cycle drive up employment, wages and commodity prices. This creates both inflation, and a reduction in housing inventory. The inflation causes buyers to get more aggressive as they see home prices going up, but also causes the fed to increase interest rates to cool down the economy and maintain price stability.
A toxic mix for home affordability is created by the rising inflation, rising real home prices, and rising interest rates. Inventories are low, so home builders are not inclined to reduce prices. What happens is volumes decline, and only the happy few that can still afford it buy a home. They are not frustrated they bought the top, they are happy they still got in.
This is why in the housing market, volume peaks before price does, and volume troughs before price does.
We see a counter-clockwise cycle on the price-volume diagram below:
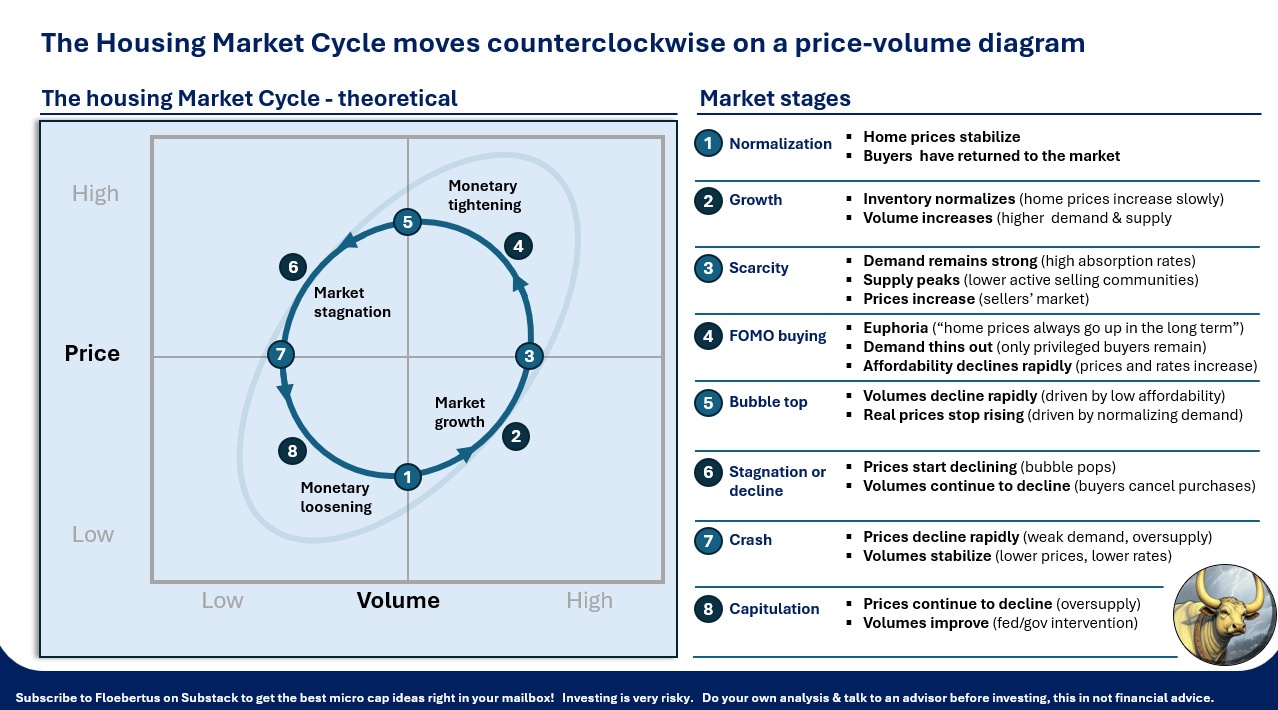
Here we roughly see the stages again, described in the 2000-2010 cycle observed above. We expect the market to move from Growth to FOMO, to stagnation, crash and capitulation, then returning to growth.
We just talked about the mechanism on the top right of the chart, were buyers are driven out of the market, and the market tops on low volume as only privileged buyers remained.
On the bottom left, the mechanism is similar, with prices declining in a bad economy, drawing buyers back in, but the way this turn is taken, is more erratic as it typically involves an element of crisis and intervention, and sometimes deleveraging. Two main scenarios can happen here: (1) Monetary easing restores home affordability and demand or (2) Monetary easing starts a slow recovery process in the economy, which slowly improves youth unemployment and savings, repairing housing demand in 2-3 years. The path followed depends on the state of the economy beyond housing, and the perception of credit risk feeding into flexible/tight home lending standards beyond just interest rates.
Testing our hypothesis with data (1995 - 2015)
It’s great to have a hypothesis for how things might work, but it’s important to test it with real data. To do this, we used St. Louis Fed data on Home from FRED on home prices, new home sales, population, and CPI.
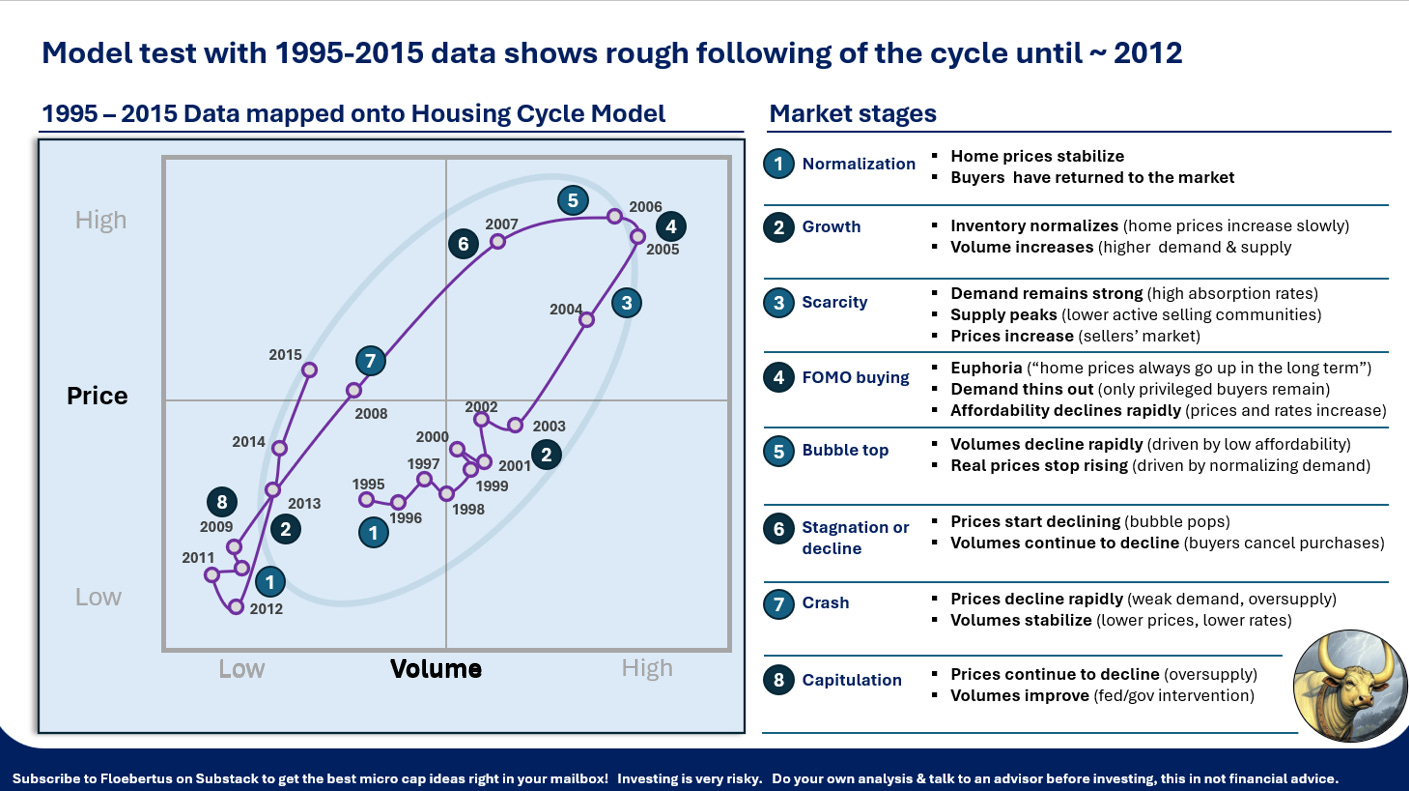
This shows normalized January home sales volume on the x-axis and normalized prices on the y-axis. Volume normalization was done by using deviation from the mean in annual home sales. Price normalization was done by using the deviation from the real home price increase trend, after estimating it through exponential regression.
From 1995 on, prices in real terms ticked up in most years, specially as of 2001 as the fed started reducing interest rates. Housing prices rocketed higher until the 2005-2006 bubble, leading to a lengthy decline reinforced by the financial crisis.
The market finally normalized and started a recovery in 2012. Here again we see volume troughing before price, before both recover. The rise in volume is quite low, likely because home builders, banks, investors and consumers remained cautious after the 2005 bubble, and of course because existing housing inventory was higher after the 2005-2006 overbuild.
There are longer term trends (affordability, urbanization, housing mix) playing into this apparent longer term moderation in new home sales per capita which we will not go into today. These may cause the cycle to be more of a leftward spiral over the long term, with first time buyers focusing more on multi-family rather than single-family houses. This seems to be the case looking at the data today, but the opposite would have been considered in 2005, so we will not draw conclusions about this.
Testing with more data (1969 - 1980)
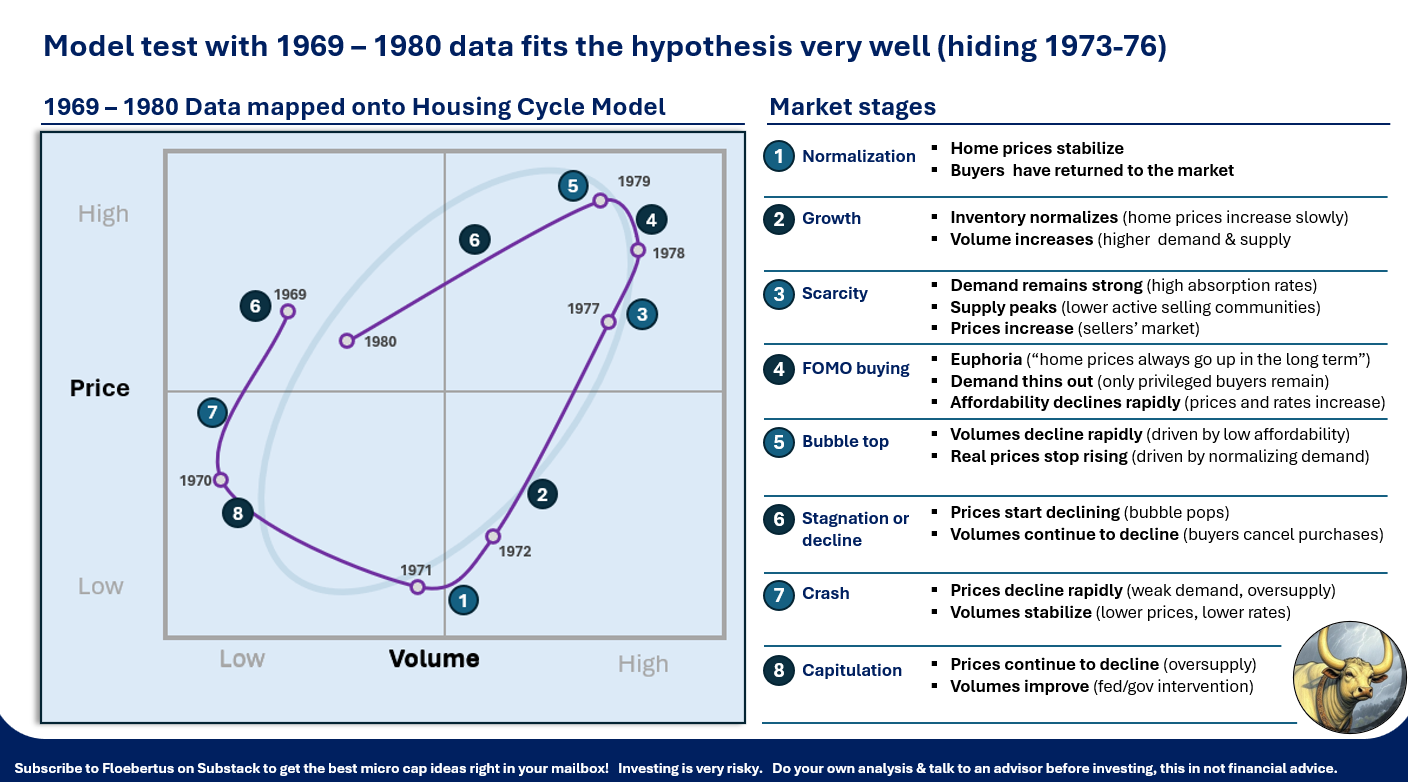
Here we see the data tracks the model quite well, except for 1973-1976, which we removed. During the removed years, oil prices tripled due to frictions in the Middle East, causing a temporary decline and recovery in new home sales.
Today’s housing market
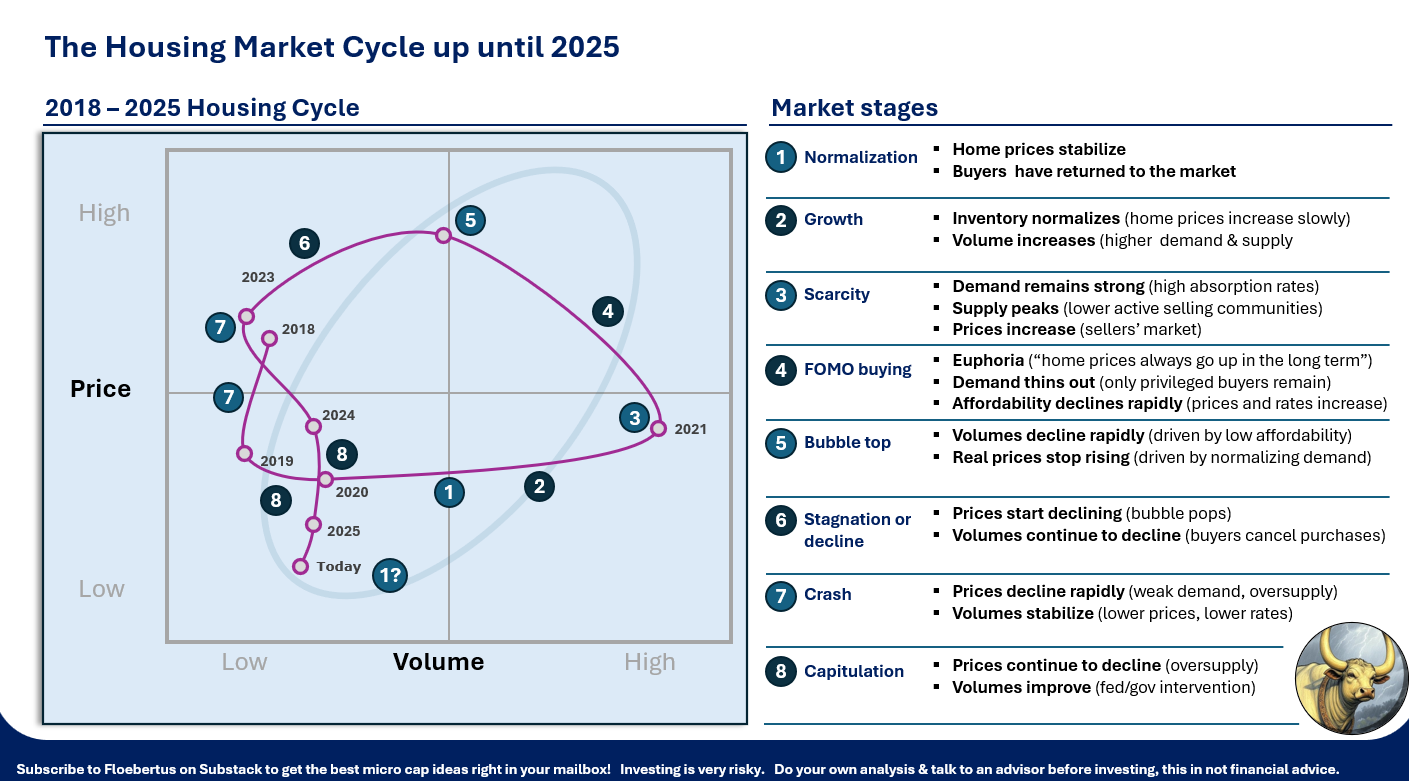
Looking at the latest cycle up until today, we see growth in new home sales in 2020 driven by fed stimulus and stay at home policies, prices picking up in 2021 driven by scarcity and inflation expectations, peaking in early 2022 as affordability drove out buyers. Volume then further went down, the economy weakened, inflation came down, and prices started declining as buyers were less anxious about rising prices, but affordability was still constrained by tight interest rates.
In 2024 the fed started cutting interest rates, affordability actually improved and new home sales volumes started to improve slightly, real prices still going down in 2025 as inventories remained high.
What’s next?
While the analysis of the current market indicates that we may be close to the bottom of a cycle, the current trend in volume and real price is negative, and reversal will likely only happen with a further shift in monetary policy.
We see 2 potential scenarios going forward:
Growth from looser financial conditions. Interest rate reduction leading to improved affordability, driving higher sales volumes and restoring growth in the housing market. This does not include a 2009 style interest rate reduction, as that came with credit stress and trauma causing true financial conditions for new buyers to be controlled, but not to be clearly loose or encouraging.
Continued weakness / no monetary easing. Interest rates might stay at their current relatively high level, if the economy and labor market continues to do well, or if inflation remains higher than expected for other reasons. This would likely cause prices and volumes to roughly remain where they are, or to further decline.
2025 is a peculiar year, as most are, because while housing has been very weak for a couple of years, the economy doesn’t seem to suffer from it. It seems that housing missed the bus, and the economy is going higher without it.
This will likely continue, until some signs of weakness or disinflation in the economy create space for further interest rate cuts, and leading to growth in the housing sector.
A new growth phase would likely create a longer less aggressive rally in housing (volumes and prices), as such a rally would start at a time of disinflation with slow interest rate cuts. This means it would likely take quite some years before it would need to be slowed down by inflation-driven interest rate hikes.
Source
Fed data sources used: Home prices, new home sales, population, and CPI.(MSPNHSUS, HSN1F, POPTHM, CPIAUCSL)
See https://fred.stlouisfed.org
My guess is that we see a bit more off scenario #2 - "Continued weakness / no monetary easing", more so than #1. What specific tickers are you looking at in this sector? Thanks for the good article
What would be a good play to make money on this? Nail ?